Introduction (परिचय)
हमने अलग-अलग Scheduling Algorithms (FCFS, SJF, Priority, Round Robin) पढ़े।
अब सवाल यह आता है:
इनमें से सबसे अच्छा algorithm कौन सा है?
इसी का answer देने के लिए हम Algorithm Evaluation करते हैं।
Algorithm Evaluation क्या होता है
Algorithm Evaluation वह process है जिसमें हम different scheduling algorithms की performance को compare करते हैं।
Evaluation क्यों जरूरी है
- Best algorithm choose करने के लिए
- System performance improve करने के लिए
- Fairness और efficiency check करने के लिए
Evaluation Methods (कैसे evaluate करते हैं)
1. Analytical Method (Mathematical Approach)
इसमें हम formulas और calculations का use करते हैं:
- Waiting Time
- Turnaround Time
- Response Time
Example:
Different algorithms के लिए average waiting time compare करना
2. Simulation Method
- Real system जैसा environment बनाते हैं
- Different algorithms को test करते हैं
Example:
Software simulation tools का use
3. Implementation Method
- Algorithm को real system में implement करते हैं
- Performance observe करते हैं
Example:
Operating System में actual testing
Important Metrics (Evaluation Criteria)
Algorithm evaluation में वही criteria use होते हैं जो हमने पहले पढ़े:
- CPU Utilization (maximize)
- Throughput (maximize)
- Turnaround Time (minimize)
- Waiting Time (minimize)
- Response Time (minimize)
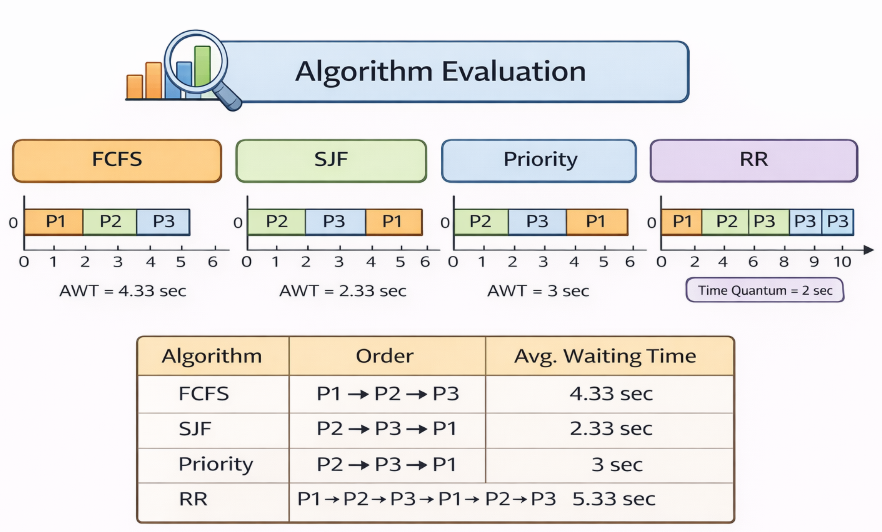
Gantt Chart (बहुत important)
Evaluation में हम अक्सर Gantt Chart use करते हैं:
- यह process execution order दिखाता है
- Time calculation में मदद करता है
Example (Simple समझ)
मान लीजिए 3 processes हैं:
| Process | Burst Time |
|---|---|
| P1 | 5 |
| P2 | 2 |
| P3 | 3 |
अब:
- FCFS → waiting time ज्यादा हो सकता है
- SJF → waiting time कम होगा
इससे हम compare कर सकते हैं कि कौन सा algorithm better है
Average Waiting Time (AWT) Formula
Average Waiting Time निकालने के लिए हम सभी processes के waiting time का average लेते हैं।
Formula:
Step by Step समझो
- हर process का Waiting Time निकालो
- सभी waiting time को add करो
- total को processes की संख्या से divide करो
Example (Simple)
मान लो:
| Process | Waiting Time |
|---|---|
| P1 | 0 |
| P2 | 3 |
| P3 | 5 |
अब:
Total Waiting Time = 0 + 3 + 5 = 8
Number of Processes = 3AWT=38=2.67
Important Point (Exam Trick)
- पहले Gantt Chart बनाओ
- फिर हर process का waiting time निकालो
- फिर average निकालो
Short Definition
Average Waiting Time = सभी processes के waiting time का average
Key Points
- Evaluation = comparison of algorithms
- Metrics based decision
- Numerical problems में use होता है
Conclusion
Algorithm Evaluation हमें यह समझने में मदद करता है कि कौन सा scheduling algorithm किसी particular situation में सबसे बेहतर है।
यह system performance को optimize करने के लिए बहुत महत्वपूर्ण concept है।